

There are two kinds of people in this world: those who love data and Excel sheets… and normal people. Or rather, people who might not always have the time or enthusiasm needed to delve into deep CSV files of raw data in order to extract what really matters and translate it into actionable information.
Here at stickee, we believe complex data shouldn’t get in the way of decisions, but instead help you make them. The amount of data you’re generating can seem a little overwhelming at first, but harnessing its power could help you make better choices for your business. Let’s take a look at big data and the impact it can have…
Your data matters
Why does data matter so much? What even is data? Depending on your industry, it can mean a wide range of things, from item prices to customer information, purchase records and even cultural trends. But no matter what kind of data you collect, it remains ‘the number one factor that will make or break a brand’s ability to deliver a great customer experience.’ (The Drum) Basically, data is essential to understand the market your company evolves in, and to understand your customers’ needs and behaviour.
In ecommerce, using big data to your advantage could give you an edge on the competition and allow you to improve overall performance. Companies such as Amazon, Netflix, and Starbucks are already using the information they collect from customers to gain insight into their needs and provide them with better service and products.
Or should we mention Capital One, the credit card and loan company who became one of the biggest American bank holding companies using big data? Back in the 90s, credit cards were very simple: each card had a limit and a rate, and you either qualified or you didn’t. Capital One, a small subsidiary of a regional US bank, used big data analytics to not only predict who would default on their debt but also to predict who would be profitable customers. They used this data to cherry pick good customers from other banks with personalised offers and promotions and went from a small provincial company to the biggest card issuer in the USA.
Data, data everywhere
Okay, so we know data is important. We also know there are tons of it everywhere you look. Sure – in depth analysis and reports are fantastic, but realistically, the decision makers often don’t have time for and don’t need to know the details. That’s why business analysts are some of the most invaluable employees of any company. They know how to pull out relevant information from all the data they’re faced with on a day-to-day basis, and they know how to interpret it. They’re the perfect data-to-human dictionary. Who doesn’t need one of those? Let’s face it, very few people in your company will have the time to sit down and crawl through endless Excel sheets filled with pricing information for, let’s say, every mobile phone contract on the market. Believe us – there’s a lot of them.
While business analysts have the understanding of the complex data, they’re not necessarily the ones making decisions and planning the overall business strategy.
Instead, they often need to translate the data in a way that managers and commercial decision makers can understand, and to make it accessible to a wider, less technically minded audience. And this takes time. Thankfully, there are ways to help make the whole process quicker and more efficient.
Reporting made simple
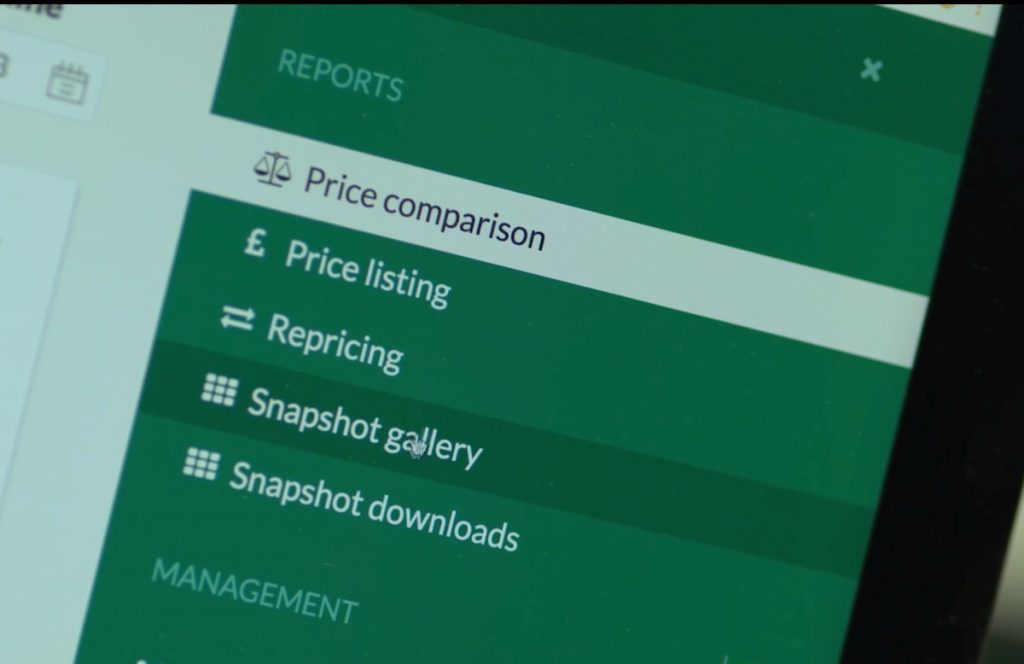
Here at stickee, we’ve developed a tool designed to help streamline and simplify data reporting and analysis, and bridge the gap between complex data and commercial decisions. This tool, called Magpie, is used to monitor competitor activities and comparison website price changes quickly and easily, and allows analysts to spend less time on manually searching through data and more time interpreting it. Don’t think it’ll replace your analyst, though – Magpie is here to help them, not steal their job.
Magpie offers 24/7 reporting to assist data analysts, managers, and anyone with an interest in monitoring pricing details across their main competitors. It automatically collects and compares pricing data every day and offers different ways of presenting this information depending on the user’s level of interest and/or knowledge:
- Raw data ‘dumps’, CSV files perfect for die-hard analysts with a passion for numbers and spreadsheets.
- Tactical reports, helping data analysts in their day-to-day activities and giving them more time to make tactical decisions. These include dashboards and email alerts.
- Strategic summaries designed for long-term strategic planning and review. These are customised and built to meet the needs of each individual client; they can be dashboards, PDFs, Excel sheets, and more as required.
By presenting information visually – from dashboard screens to pre-filtered Excel sheets with colour-coded cells – senior managers and non-data experts can view and extract the information they need to make pricing decisions. (What this information is depends on each individual client, and this is why Magpie reporting is fully customisable.)
The advantage of using a software to extract data means it’s much quicker and much more accurate than trying to collect and organise the data manually.
For example, Magpie helps a major UK high-street retailer to collect and analyse over half a million prices, from a dozen competitors. To do this manually would take weeks, by which time the data would be out of date and therefore useless.
Magpie updates the full set of data twice a day, and then provides price-change summary reports, allowing our client to focus quickly on what matters.
Using a platform that is quick and accessible to all people in your business will allow you to bridge the gap between data and decisions; anyone with a stake in the overall business strategy can understand the information and decide which action to take. If data is an integral part of your business and you want to make the most out of it, get in touch with some of our experts who will be happy to help you.